Book Review: Model-Driven DevOps
Thursday, June 29, 2023 at 6:22 p.m. UTC by stretch
Earlier this month at Cisco Live in Las Vegas, I attended a presentation by Steven Carter and Jason King titled Model-Driven DevOps: The Enterprise Automation Framework You've Been Looking For! They discussed the importance of robustly modeling your network data — a quality very dear to me, as you might expect — and having a clear strategy for automating changes, and shared an example automation architecture for reference. It was a refreshing take on introducing network engineers to DevOps methodologies, and the first time I've seen anyone clearly map software development practices to network automation.
Interested to dive deeper into the material than a 45-minute session would allow, I was pleased to learn that their talk derived from a book of the same name that they co-authored. Coupled with the lingering geeky high from Cisco Live, it made for an excellent read on the flight back home.
The book's content is broken into seven easily digestible chapters, each dedicated to a particular step along a path toward network automation:
- Chapter 1: A Lightbulb Goes Off
- Chapter 2: A Better Way
- Chapter 3: Consumable Infrastructure
- Chapter 4: Infrastructure as Code
- Chapter 5: Continuous Integration/Continuous Deployment
- Chapter 6: Implementation
- Chapter 7: Human Factors
Observations on Seven Years of Maintaining Open Source
Friday, June 16, 2023 at 6:04 p.m. UTC by stretch
June 27th marks the seventh anniversary of NetBox, a one-time hobby project which quickly took off and today largely consumes my life. What began as a proof-of-concept solution for the network engineering team at DigitalOcean is now perhaps the most widely deployed network source of truth in the world.
This feels like an opportune time to reflect on some lessons I've learned along the way, with the hope of offering mixed encouragement and caution to those considering a similar path. And as I've felt the urge to pick up blogging again, this post will also serve to share what I've been up to recently.
Most articles about open source in general are boring. Reading about licenses and software governance feels like a punishment. Keenly aware of this fact, I'll do my best to navigate around the theory and stick with observations that are of practical use to the aspiring open source maintainer.
Templating Device Configurations
Tuesday, October 8, 2019 at 12:57 p.m. UTC by stretch
One of the core functions of network automation is the ability to generate network device configurations from a template. This is a discrete, intentional process which unfortunately is often conflated with the totally separate act of applying a rendered configuration to a device. In this article we'll look at how to establish a template from existing configurations, define and organize variable data, and ultimately render a series of configurations automatically using a simple Python script.
What is a Template?
The term template describes any sort of mold or pattern from which new, identical objects can be created. For instance, a cookie cutter is a sort of template that can be used to create an arbitrary number of identically-shaped cookies from a sheet of dough. But in our case, we're inexplicably more interested in creating network device configuration files than baking cookies, and creating wholly identical copies of a file isn't terribly useful, since each network device typically has a handful of unique characteristics such as hostname, authentication credentials, IP addresses, and so on.
To address this need to define changing pieces of data within an otherwise unchanging document, we employ variables. A variable serves as a placeholder within the template, signifying a particular piece of data that needs to be filled in. The below form is an example of a simple template.

Real World APIs: Snagging a Global Entry Interview
Wednesday, August 7, 2019 at 12:19 a.m. UTC by stretch
As my new job will have me traveling a bit more often, I finally bit the bullet and signed up for Global Entry (which is similar to TSA PreCheck but works for international travel as well). A few days after submitting my application and payment, I was conditionally approved. The next step was to schedule an “interview,” which is essentially a 10-minute appointment where they ask a few questions and take biometrics. The interview must be done in person at one of relatively few CBP locations.
Here in Raleigh, North Carolina, my two closest locations are Richmond and Charlotte. Unfortunately, CBP’s scheduling portal indicated no availability for new appointments at either location. No additional context is provided, so I have no idea whether I should keep trying every few days, or attempt to schedule an appointment at a remote location to coincide with future travel.
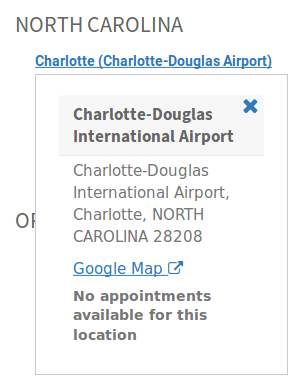
My only hope at this point is that spots will eventually open up as other applicants cancel their appointments or CBP adds sufficient staff to meet demand. But that means manually logging into the portal, completing two-factor authentication, and checking both of my desired appointment locations each and every time.
Sounds like a great use case for automation, doesn’t it?
Connection Restored
Friday, August 2, 2019 at 12:46 p.m. UTC by stretch
I was embarrassed to realize recently that it’s been well over two years since my last blog post. Life has a way of getting away from you, I suppose. But I’ve decided to try and reboot the blog, and hopefully get back to writing regularly. Let me kick things off my sharing what I’ve been up to recently.
Goodbye, DigitalOcean!
After nearly five years working at DigitalOcean, I made the difficult decision to part ways with the company. In my time there, I was fortunate to work with an amazing team, and witness the truly amazing evolution of a startup company from niche player to major cloud provider. Most of all, I’m thankful to DigitalOcean for the opportunity my role provided in extending from traditional network engineering into development and automation. I’ll miss working with my DO team, but I’m excited to see where the future will take them.
Three Months with Google Fiber
Friday, January 6, 2017 at 2:40 p.m. UTC by stretch
I'm one of the lucky few to benefit from Google Fiber's recent expansion into new regions (before they nixed the whole thing). I've had the service fire three months now and figured I should write up my experience with it thus far.
The Installation
Google Fiber announced that it would be expanding to the Raleigh-Durham metro area, known locally as "The Triangle", in January 2015. It's been a long game of hurry-up-and-wait since then, watching crews laying fiber all over town without hearing a peep from Google regarding availability. But in the fall of 2016, people were finally able to start signing up for service. Here's how my installation went.
September 3
Google Fiber registration opens! I sign up for service and pay a paltry $10 deposit, which gets credited toward my first bill. Over the next couple weeks, various utilities swing by to mark their lines in the ground. (Here's the color code for utility markings in the US, if you're curious.)
September 24
Google's contractor arrives on site to lay fiber from the curb to my house and to many of my neighbors' houses. Surprisingly, they cut my trench by hand, possibly due to the steep incline of my side yard.
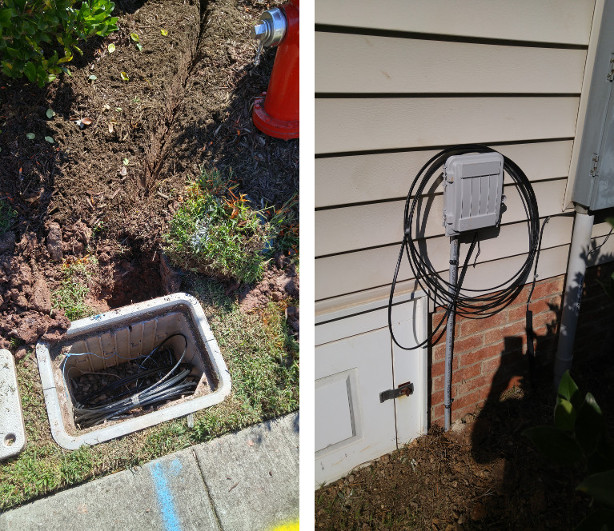
The outside installers ran a single pair of fiber to a box mounted on the side of my house, with the remainder of the installation to be completed by the indoor tech. (As with Verizon FiOS, only one strand is needed for service.)
September 27
I receive a notification to schedule my installation. Of course, I pick the first available slot: 9:40am on October 3.
Legacy TLS cipher support in Firefox
Wednesday, October 12, 2016 at 5:45 p.m. UTC by stretch
After upgrading Firefox recently, I noticed that I could no longer access certain embedded devices via HTTPS. It seems that recent versions of Firefox and Chrome no longer support certain TLS ciphers due to recently discovered vulnerabilities. That's all well and good, except the error returned offers no recourse if you need to connect anyway.
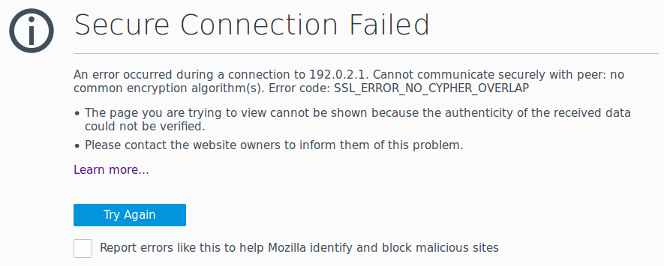
Firefox returns the error SSL_ERROR_NO_CYPHER_OVERLAP with no option to temporarily allow connectivity. (Chrome reports a similar error named ERR_SSL_VERSION_OR_CIPHER_MISMATCH.) Presumably, this choice was made by the developers with the intention of forcing people to upgrade outdated devices. Unfortunately, in order to upgrade an out-of-date device, we typically must first be able to connect to it. I wasted a fair bit of time digging up a solution, so I figured I'd document the workaround here for when I inevitably run into this problem again a year from now and have forgotten what I did.
The Overlay Problem: Getting In and Out
Friday, September 30, 2016 at 1:47 p.m. UTC by stretch
I've been researching overlay network strategies recently. There are plenty of competing implementations available, employing various encapsulations and control plane designs. But every design I've encountered seems ultimately hampered by the same issue: scalability at the edge.
Why Build an Overlay?
Imagine a scenario where we've got 2,000 physical servers split across 50 racks. Each server functions as a hypervisor housing on average 100 virtual machines, resulting in a total of approximately 200,000 virtual hosts (~4,000 per rack).
In an ideal world, we could allocate a /20 of IPv4 space to each rack. The top-of-rack (ToR) L3 switches in each rack would advertise this /20 northbound toward the network core, resulting in a clean, efficient routing table in the core. This is, of course, how IP was intended to function.
Unfortunately, this approach isn't usually viable in the real world because we need to preserve the ability to move a virtual machine from one hypervisor to another (often residing in a different rack) without changing its assigned IP address. Establishing the L3 boundary at the ToR switch prevents us from doing this efficiently.
Taking the CCIE Lab in RTP
Friday, July 29, 2016 at 2:13 a.m. UTC by stretch
Cisco's campus in Research Triangle Park, North Carolina, is one of only two places in the United States where candidates can complete a CCIE lab exam (the other being in San Jose, California). People fly in from all over the eastern US and beyond to spend a day taking the exam. Lots of folks who've taken the exam have written up their experiences, but I haven't seen many talk at length about their time in RTP outside of Cisco's building 3.
I've lived just a few minutes away from the testing site for the past few years, and it occurred to me recently that visitors might benefit from some local knowledge.
Getting Here
Most people fly in via Raleigh-Durham International Airport (RDU). RDU is a medium-sized airport with two terminals. Most flights operate out of Terminal 2, except for Southwest Airlines, which is based in the newly-renovated Terminal 1.
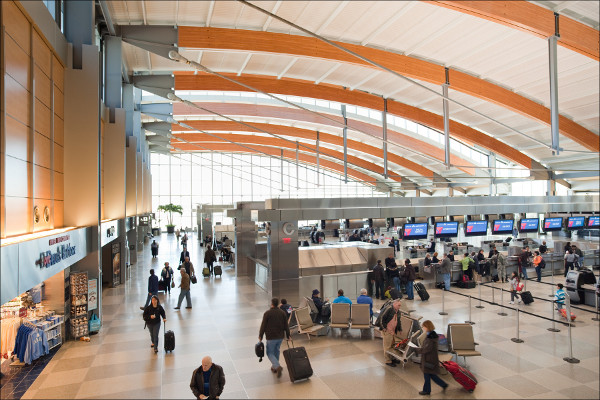
As airports go, I'm a big fan of RDU. It's a very modern, clean, and well-organized facility. The interior of Terminal 2 is beautifully designed to resemble an early airplane wing and is flooded with natural light during the day. (It's also one of very few places where you can find a Five Guys that serves breakfast.) The TSA folks here tend to be very professional and polite. Wait times in security are rarely long. And this isn't just the biased opinion of a local: in 2014, RDU was ranked among the top ten airports in the US.
NetBox v1.1.0 Released
Thursday, July 7, 2016 at 6:45 p.m. UTC by stretch
One year ago today, I made the first commit to a repository named "netbox" hosted internally at DigitalOcean. It was the first iteration of a tiny little app I scratched together using the Django Python framework to track IP prefix utilization. A year later, NetBox has grown into an extensive tool that we use to track IPs, racks, devices, connections, circuits, and even encrypted credentials. And I'm happy to say that it's now open source!