The premiere source of truth powering network automation. Open and extensible, trusted by thousands.
NetBox is now available as a managed cloud solution! Stop worrying about your tooling and get back to building networks.
Long-Term Traffic Capture With Wireshark
By stretch | Wednesday, March 9, 2011 at 3:46 a.m. UTC
A reader recently asked for my opinion on building a server to be dedicated to network traffic capturing with Wireshark. While Wireshark is an excellent packet analysis application, its graphical interface is quite demanding on system resources (memory in particular) and is intended for use only in low-throughput environments or offline packet analysis (where packets are read from a file on disk).
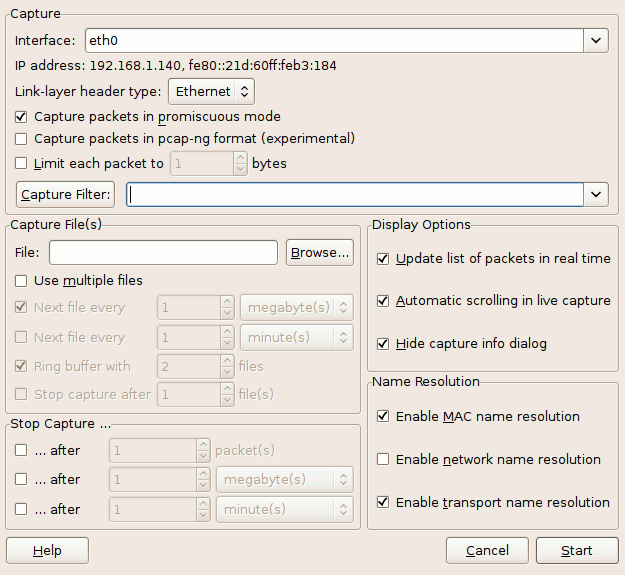
For persistent traffic collection, such as that performed by an IDS/IPS, many people opt to use the popular packet capture utility tcpdump. Alternatively, the Wireshark package includes a very small command line utility (less than one tenth the size of tcpdump) called dumpcap. I explained in the article Sniffing with Wireshark as a Non-Root User that Wireshark relies on the dumpcap executable for its core packet capturing functionality, with more complex features offloaded to the Wireshark GUI and tshark. In fact, the Wireshark capture options dialog pictured below is primarily a wrapper for arguments passed to dumpcap.
dumpcap can be run independently from Wireshark to capture packets to a file or series of files on disk, and makes for an efficient long-term capture solution. Further, like tcpdump, it is built on the libpcap library and uses the same capture filter syntax.
We can start a very basic packet capture by invoking dumpcap with the command below. -i eth0 specifies the capture interface and -w packets.cap specifies the name of the capture file to be written. Ctrl-C terminates the capture cleanly.
$ dumpcap -i eth0 -w packets.cap
File: packets.cap
Packets: 625 Packets dropped: 0
$ ls -lh packets.cap
-rw------- 1 stretch stretch 942K 2011-03-07 15:48 packets.cap
Now we have a 942 KB capture file that we can open in Wireshark for analysis at our leisure.
Of course, if we intend to capture gigabytes of data, a single file becomes too unwieldy to manage. We can tell dumpcap to begin writing a new file every time the current file reaches a given size (in kilobytes). The filename given will be appended with a serial number and timestamp to ensure uniqueness.
$ dumpcap -b filesize:10000 -w packets.cap
File: packets_00001_20110307155841.cap
Packets: 7788 File: packets_00002_20110307155904.cap
Packets: 17887 File: packets_00003_20110307155921.cap
Packets: 25950 File: packets_00004_20110307155933.cap
Packets: 33861 File: packets_00005_20110307155941.cap
Packets: 41583 File: packets_00006_20110307155949.cap
Packets: 46751 Packets dropped: 0
$ ls -lh
total 56M
-rw------- 1 stretch stretch 9.8M 2011-03-07 15:59 packets_00001_20110307155841.cap
-rw------- 1 stretch stretch 9.8M 2011-03-07 15:59 packets_00002_20110307155904.cap
-rw------- 1 stretch stretch 9.8M 2011-03-07 15:59 packets_00003_20110307155921.cap
-rw------- 1 stretch stretch 9.8M 2011-03-07 15:59 packets_00004_20110307155933.cap
-rw------- 1 stretch stretch 9.8M 2011-03-07 15:59 packets_00005_20110307155941.cap
-rw------- 1 stretch stretch 7.1M 2011-03-07 16:00 packets_00006_20110307155949.cap
We can also use the duration keyword in place of filesize to specify a length of time (in seconds) to spend filling each file (for example, one hour, or 3600 seconds). And to avoid eventually filling the entire hard disk with capture files, we can include the files parameter to set up a ring buffer: Once the maximum number of files have been saved, the oldest file is deleted and a new empty file is created in its place. The example below shows how we can instruct dumpcap to maintain a rotating record of the last 24 hours worth of traffic:
$ dumpcap -i eth0 -b duration:3600 -b files:25 -w packets.cap
As I mentioned earlier, we can also specify a libpcap filter to restrict the types of traffic captured by dumpcap. For example, the following command captures only DNS traffic destined to or coming from 208.67.220.220:
$ dumpcap -i eth0 -f "host 208.67.220.220 and udp port 53" -w dns.cap
A full description of libpcap filter syntax is available in the libpcap-filter manpage.
Posted in Packet Analysis
Comments
March 9, 2011 at 7:35 a.m. UTC
Nice article, this will definitely help in the future. WireShark is a great tool in troubleshooting network-related problems, but I so hate the GUI for the capture of traffic.
The GUI is perfect for analysis only, so dumpcap will be the tool I will start using for traffic capture.
March 9, 2011 at 11:17 a.m. UTC
Thanks for such a good tutorial...
March 9, 2011 at 11:52 a.m. UTC
I am keeping this in mind!
March 9, 2011 at 5:23 p.m. UTC
I've had good luck in the past running long term captures with a ring buffer of several hundred 200MB files using the Wireshark GUI. Disabling the "Update List of Packets in Real Time" option allowed Wireshark to run for more than a week at a time in continuous capture mode. The scrolling display cannot keep up with a high volume packet capture, and eventually gets so far behind that it is still displaying data from the first capture file in the buffer when Wireshark is attempting to overwrite that file. At this point, Wireshark gives up and crashes.
March 9, 2011 at 8:38 p.m. UTC
I've definitely been able to do very long-running captures with the Wireshark GUI, but like the previous commenter I've found you need to disable the real-time packet list for stability. I've also taken to (on a Windows PC) unbinding IP and all other protocols besides the WinPCap driver from the interface, and killing any extraneous process running on the machine. Set power preferences to do nothing upon closing the laptop's lid, make sure the rest of the power profile is set never to sleep or spin anything down.
I've also found selecting the ring buffer parameters to be a minor art. You don't want the buffer file to be anywhere near the amount of physical RAM in your capture machine. You also don't want to be turning the file over every 5 minutes. You want to keep plenty of space on disk for operating system scratch/swap room. And based on the frequency of the problem and the ability to get back to the site to collect the files you need to make sure the ring is large enough that you won't lose the occurrence due to overwrite.
In extreme cases I've captured 50-60 GB of data in 500MB slices over the course of a week and had no problems with the capture machine using this recipe.
With all that said, I will definitely be playing around with dumpcap more. A much cleaner option, especially on a Linux host.
March 9, 2011 at 10:59 p.m. UTC
Thanks for the write I knew about tcpdump but not dumpcap I will be playing with asap.
March 9, 2011 at 11:15 p.m. UTC
Also check out gulp, which claims to be high-performance and supports ERSPAN.
March 10, 2011 at 2:13 a.m. UTC
Also check out daemonlogger from mroesch: http://www.snort.org/users/roesch/Site/Daemonlogger/Daemonlogger.html
March 10, 2011 at 4:48 a.m. UTC
Here's an example wireshark (read tshark) CLI command that I use for not-short-term-captures on a Windows7 box.
tshark -i %InterfaceName% -B 32 -b filesize:50000 -b files:2000 -n -w "%userprofile%\Documents\%SwitchName%.pcap" -F libpcap -z io,stat,300
It's part of an self-installing script I use, this is the meat in the sandwich though.
Enjoy.
March 13, 2011 at 3:38 a.m. UTC
Awesome tutorial.
Clean way to capture.
March 14, 2011 at 12:04 a.m. UTC
Actually on Linux I found using iptables & ulogd to be more scalable solution for traffic capture:
1) iptables –t raw -A PREROUTING -i eth0 -p tcp -j ULOG --ulog-qthreshold 50
2) configure ulod.conf to include:
plugin="/usr/local/lib/ulogd/ulogd_PCAP.so"
Advantage is that this approach makes possible fairly complex filters with iptables with filtering of packets occuring very early in kernel. No restart of capturing utility is needed if filters need to change. Additional tuning is to configure interrupt coalescing on the NICs and to increase amount of memory for kernel for really high packet rates (>200000 pak/sec) plus robust disk subsystem is needed.
March 15, 2011 at 2:19 p.m. UTC
Actually an alternative for targeted captures oriented to specific protocols like dns, rtp, radius and so on we use tshark (included with wireshark) to do text decoded captures and load the parsed output straight into a DB.
This is quite easy to achieve and is a very, very nice tool to produce a point in time view of your network. Providing you know what your are supposed to see on your network.
Marc
June 2, 2011 at 12:05 a.m. UTC
I LOVE YOU! This is just what i needed man, you saved my life today
August 15, 2011 at 8:59 a.m. UTC
Checkout http://www.openfpc.org it got all the set of tools to justify a full packet capture server and a nice installscript to get them all working together including a sql database for session tracking and a nice web gui for searching and packet extraction. It uses daemonlogger from sourcefire for its packet dump daemon.
October 28, 2011 at 8:13 a.m. UTC
If you want to run dumpcap on windows, there is just one more step to it.
The interface name on Windows systems are not simple eth0 or wlan0 like in Linux. Running dumpcap with -D switch will display the list of interfaces with GUID. Copy the GUID of necessary interface and pass it as argument for -i switch and run dumpcap again.
September 11, 2012 at 12:58 p.m. UTC
Thanks, nice and easy-understanding guideline.
May 27, 2013 at 5:32 a.m. UTC
thanx a lot.....was very useful
June 4, 2013 at 9:59 a.m. UTC
Very useful. Thank you Jeremy.
October 15, 2013 at 8:53 a.m. UTC
Hey Jeremy, Very useful post, thanks. I'm trying to use packets as a data source for sound triggering, loaded into Flash or a Javascript script as text/xml. Ideally these source files would be as little delayed from 'realtime' (the present moment) as possible. Would running 1 minute interval logs in Wireshark, with a 1 file 'ring buffer' create problems? Is there a better way to do this?
March 29, 2014 at 1:04 p.m. UTC
Thanks Stretch. Well explained. Came handy in solving a problem. btw, nice challenge for posting comment.
August 3, 2015 at 5:37 p.m. UTC
Great Blog Post! Clean understandable and great examples
August 10, 2015 at 8:52 p.m. UTC
First of all thanks for your really helpful post! and my question is how can I capture packets from the network interface at very high/wire speed. I have used many tools but in each case amount of packets lost is very high. Thanks
January 7, 2016 at 6:46 p.m. UTC
Thanks for another informative yet succinct post!
May 9, 2016 at 4:22 a.m. UTC
solid post - very informative, well written, and helpful.
June 6, 2016 at 2:27 p.m. UTC
Great post! Very useful.
On Windows OS, since Windows 7 and Windows Server 2008 R2: they have the ability to capture traffic without installing third party software on the computer using the command: netsh trace
Extracted from: Windows capturar tráfico