The premiere source of truth powering network automation. Open and extensible, trusted by thousands.
NetBox is now available as a managed cloud solution! Stop worrying about your tooling and get back to building networks.
Proving the Network is Not the Problem With iperf
By stretch | Monday, February 28, 2011 at 3:37 a.m. UTC
When an application fails to perform as expected, the network is often the first thing blamed. I suppose this is because end users typically view the network as the sole limiting factor with regard to throughput, unaware of the intricacies of application, database, and storage performance. For some reason, the burden of proof always seems to fall onto networkers to demonstrate that the network is not at fault before troubleshooting can begin elsewhere. This article demonstrates how to simulate user traffic between two given points on a network and measure the achievable throughput.
Suppose a user somewhere at the edge of the network submits a ticket reporting that a web-based inventory application is performing slowly. Everything seems normal on the network, so you attempt to reassign the ticket to the software developers responsible for maintaining the application in question. But they want proof that it's not the network. You tell them that you want proof that it's not the application, and some rather hurtful emails are exchanged. Eventually the boss steps in and makes it clear that, per protocol, the network will be presumed guilty until proved innocent.
It's now up to you to produce some hard numbers defending the network's integrity. Where do you turn?
iperf
iperf is one of the most popular tools for analyzing network performance. The application is a simple command line executable which can act as either a server or client, and is available on a variety of platforms. There is also a Java-based GUI called jperf which is convenient in that it presents all of iperf's features without requiring the user to recall command line arguments.
Returning to the scenario above, we can test end-to-end throughput by running iperf in server mode on the application server and in client mode on the user's workstation. To simulate the application traffic as best as possible, we'll also need to gather some details about the protocol(s) used by the application, such as whether it runs over TCP or UDP and what port numbers are in use.
To set up the test, we'll start iperf in server mode on the application server. (Note that if testing iperf using the same port number as the application, the application service will need to be terminated to allow iperf to bind to the port.) The command below initializes the iperf server on TCP port 8042.
Server$ iperf -s -p 8042
------------------------------------------------------------
Server listening on TCP port 8042
TCP window size: 85.3 KByte (default)
------------------------------------------------------------
Next, we'll run iperf in client mode on the user's workstation. The options in the command below specify the following:
- -c 192.168.1.5 - Run in client mode and connect to the server at 192.168.1.5.
- -p 8042 - Connect to port 8042 (defaults to TCP).
- -t 15 - Run the test for 15 seconds.
- -i 1 - Print statistics to the console every second.
- -f m - Displays speeds in Mbps.
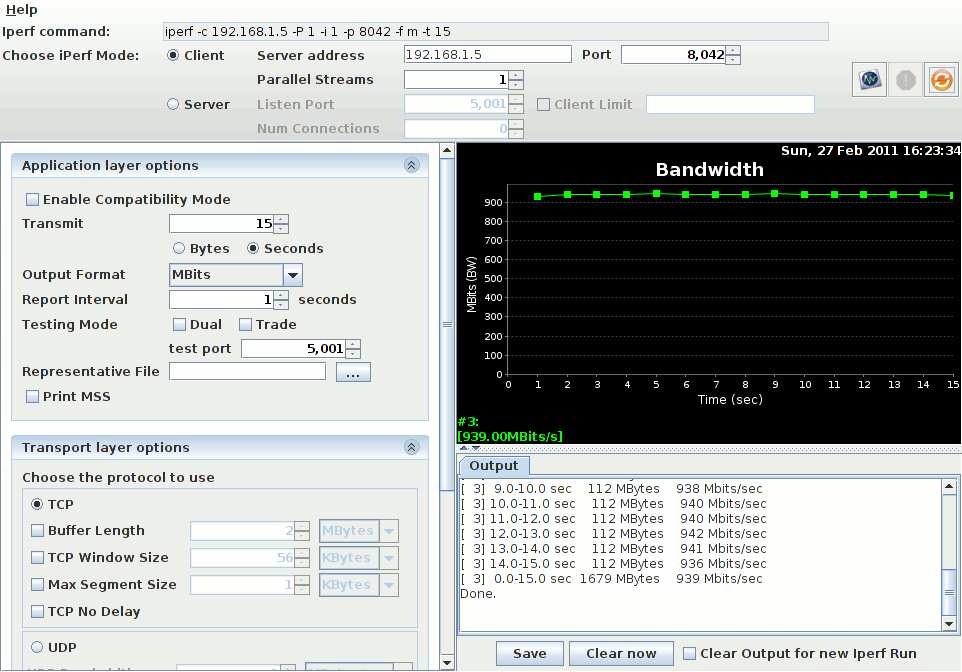
Client$ iperf -c 192.168.1.5 -p 8042 -t 15 -i 1 -f m
------------------------------------------------------------
Client connecting to 192.168.1.5, TCP port 8042
TCP window size: 0.02 MByte (default)
------------------------------------------------------------
[  3] local 192.168.1.140 port 36057 connected with 192.168.1.5 port 8042
[ ID] Interval       Transfer     Bandwidth
[  3]  0.0- 1.0 sec    110 MBytes    927 Mbits/sec
[  3]  1.0- 2.0 sec    112 MBytes    941 Mbits/sec
[  3]  2.0- 3.0 sec    112 MBytes    937 Mbits/sec
[  3]  3.0- 4.0 sec    112 MBytes    939 Mbits/sec
[  3]  4.0- 5.0 sec    112 MBytes    940 Mbits/sec
[  3]  5.0- 6.0 sec    112 MBytes    939 Mbits/sec
[  3]  6.0- 7.0 sec    112 MBytes    942 Mbits/sec
[  3]  7.0- 8.0 sec    112 MBytes    937 Mbits/sec
[  3]  8.0- 9.0 sec    112 MBytes    939 Mbits/sec
[  3]  9.0-10.0 sec    112 MBytes    939 Mbits/sec
[  3] 10.0-11.0 sec    112 MBytes    942 Mbits/sec
[  3] 11.0-12.0 sec    112 MBytes    944 Mbits/sec
[  3] 12.0-13.0 sec    112 MBytes    937 Mbits/sec
[  3] 13.0-14.0 sec    112 MBytes    944 Mbits/sec
[  3] 14.0-15.0 sec    112 MBytes    940 Mbits/sec
[  3]  0.0-15.0 sec  1679 MBytes    939 Mbits/sec
From the output above we see that the lowest observed throughput within a one-second interval was 927 Mbps, with an average rate of 939 Mbps. These numbers approach the maximum practical throughput for a 1 Gbps Ethernet link, and strongly suggest that the network is not at fault.
Here's what the client side looks like using the jperf GUI:
iperf can also be used to test throughput over UDP. An important difference here is that the target throughput needs to be specified with the -b flag. The output below shows a UDP test rate-limited to 10 Mbps. The statistics at the end also include jitter and packet loss.
Client$ iperf -c 192.168.1.5 -u -p 8042 -b 10m -t 10 -i 1 -f m
------------------------------------------------------------
Client connecting to 192.168.1.5, UDP port 8042
Sending 1470 byte datagrams
UDP buffer size: 0.12 MByte (default)
------------------------------------------------------------
[  3] local 192.168.1.140 port 39209 connected with 192.168.1.5 port 8042
[ ID] Interval       Transfer     Bandwidth
[  3]  0.0- 1.0 sec  1.19 MBytes  10.0 Mbits/sec
[  3]  1.0- 2.0 sec  1.19 MBytes  10.0 Mbits/sec
[  3]  2.0- 3.0 sec  1.19 MBytes  10.0 Mbits/sec
[  3]  3.0- 4.0 sec  1.19 MBytes  10.0 Mbits/sec
[  3]  4.0- 5.0 sec  1.19 MBytes  10.0 Mbits/sec
[  3]  5.0- 6.0 sec  1.19 MBytes  10.0 Mbits/sec
[  3]  6.0- 7.0 sec  1.19 MBytes  10.0 Mbits/sec
[  3]  7.0- 8.0 sec  1.19 MBytes  10.0 Mbits/sec
[  3]  8.0- 9.0 sec  1.19 MBytes  10.0 Mbits/sec
[  3]  9.0-10.0 sec  1.19 MBytes  10.0 Mbits/sec
[  3]  0.0-10.0 sec  11.9 MBytes  10.0 Mbits/sec
[  3] Sent 8505 datagrams
[  3] Server Report:
[  3]  0.0-10.0 sec  11.9 MBytes  10.0 Mbits/sec  0.046 ms    0/ 8504 (0%)
[  3]  0.0-10.0 sec  1 datagrams received out-of-order
Posted in Tips and Tricks
Comments
February 28, 2011 at 3:59 a.m. UTC
Also a great tool to prove it is the network when you think your service provider link is not living up to what it should be. Used it many times to show where the issue lies.
February 28, 2011 at 7:46 a.m. UTC
Hi Jeremy,
Thanks for the post!
iperf has been a great help to me in the past to achieve rapid convergence for "Problem Responsibility Establishment Protocol" (previoulsy known as "Blame Establishment Protocol" in the draft specification). It can also help to achieve a loop-free topology for trouble ticket forwarding process.
In what situations would you use iperf vs. ttcp? Since ttcp is supported on IOS I assume it can be used if the testing doesn't require a endpoint.
Now that I think about it applicaton performance analysis will almost certainly require an endpoint, but if we're doing pure circuit testing.... ummm ok maybe I just answered my own question.
Any other thoughts/ideas?
Thanks,
Hugh
February 28, 2011 at 7:59 a.m. UTC
Love this tool. Used it so many times to just prove the point network is not guilty: "In your face application developper!!"
February 28, 2011 at 8:13 a.m. UTC
Hi,
what if there is a problem with the MTU?
i.e. the internet connection is ADSL. We use a Dialer with MTU 1492. The ISR routers won't fully open sites like microsoft.com, yahoo.com, hotmail.com and a lot more. Another traffic is working great.
Using the command "ip tcp adjust-mss 1452" on the LAN interface solves this problem.
How can we test if there is a MTU problem like we would have if we would not use the "ip tcp adjust-mss 1452"?
February 28, 2011 at 8:37 a.m. UTC
For MTU issues, you can use other tools, like ping -l to send packets of different sizes and from that you can work out what to set your mtu and adjust mss to (mss should normally be 40bits smaller than MTU). Alternatively, get TCP Optimizer from http://www.speedguide.net/downloads.php as that automates the process of calculating MTU size
February 28, 2011 at 8:50 a.m. UTC
I didn't knew there was a GUI, nice. I'll have to try it out.
February 28, 2011 at 8:54 a.m. UTC
You tell them that you want proof that it's not the application, and some rather hurtful emails are exchanged. Eventually the boss steps in and makes it clear that, per protocol, the network will be presumed guilty until proved innocent.
So f*cking true...
February 28, 2011 at 9:33 a.m. UTC
scarface: ping with a size you want to see, with the don't fragment bit set?
February 28, 2011 at 9:48 a.m. UTC
...or mturoute
February 28, 2011 at 9:57 a.m. UTC
I often use -d for full duplex testing
I also use -w 65535, and adjust the second value when I need to test something specific
February 28, 2011 at 11:39 a.m. UTC
What sucks with Windows, at least older versions, not sure about Windows 7 is that you need to reboot after changing the window size to something > 64k. I used to work for an ISP and during that time I had maybe 15 complaints about the speed. Not a single time was there an issue with the network just people not knowing the basics of TCP or performance testing. Guess you can't expect a customer to know these things but still, could do some more testing before opening a ticket.
February 28, 2011 at 11:58 a.m. UTC
Nice post ! I love using iperf. Please also check Netstress, a GUI based tool that serves the same purpose (only runs in Windows). I prefer iperf since it will run on several OS platforms.
See Wireless Throughput Testing - WiFi Edge - http://goo.gl/xHiLm
-steve
February 28, 2011 at 12:02 p.m. UTC
there is other tools ttcp is do same thing test network performence .. ty so mcuh to share it
February 28, 2011 at 1:49 p.m. UTC
iperf is great for showing that with synthetic traffic, the problem isn't yours. But it doesn't solve the problem that your employer has - namely that a business application doesn't work and the employees are now finger pointing.
Solving problems like this is the difference between a network grunt who is putting in his time and a real engineer who is worth their weight in gold. There is no way a software developer is going to be able to solve these problems. They often hinge on some aspect of networking.
For a truly eye opening experience, watch one of Hansang Bae's presentations at the SharkFest conference. He's responsible for the network group that goes out and solves problems like this at Citigroup. The slides are available online (or just go, it's the best conference out there).
February 28, 2011 at 3:25 p.m. UTC
For those who like using iperf, I would highly recommend the perfsonar toolkit for network troubleshooting, developed by Internet2. You can either install the tools individually, or you can run off a boot cd, where everything is already setup for you and accessible through a simple web interface.
We deploy a perfsonar node in each location where we have some type of network/server infrastructure and run tests ever X amount of hours to verify network performance and availability. There are also a bunch of perfsonar nodes throughout the country that are available for testing, which can help isolate issues on specific paths (ie. limited bandwidth, mtu mismatches, etc).
February 28, 2011 at 4:38 p.m. UTC
There is no way a software developer is going to be able to solve these problems. They often hinge on some aspect of networking.
I certainly hope they'd be able to solve some problems on their own. Otherwise, what are they being paid for? I'm all for collaborative troubleshooting, but believe me, there are plenty of potential application issues which are solely software-related.
February 28, 2011 at 4:45 p.m. UTC
The problem with tools like iperf is the need to install a client on machines. I developed a "speed test" tool that runs on a webpage. I use javascript to time the download a jpeg of known size from several servers across my network and 2 off campus. It looks at the time it takes to download the picture and stores it in a MySQL db. It also grabs the browser string because different browsers will take different times to download the jpeg. I can then have baseline runs and runs when people say "The network is slow". Most of the time it turns out that it's not the network but Novell Groupwise or Novell shares are slow. Which is handled by a separate group. iperf does have its advantages though. I can't saturate my 10Gbps link with my speed test, but iperf can.
February 28, 2011 at 5:15 p.m. UTC
I certainly hope they'd be able to solve some problems on their own. Otherwise, what are they being paid for? I'm all for collaborative troubleshooting, but believe me, there are plenty of potential application issues which are solely software-related.
I think that yes, developers should be able to solve these problems but they don't. Often the frameworks the developers use hide what's going on under the hood. They don't understand that if the default for a web service call is HTTP 0.9 that it won't go through your transparent proxy. Or that the way they used their ORM causes ten times as much data to come through, or that behind the scenes it's requesting things row by row.
What I'm getting at is that any time you forward a ticket, it had better include more than "iperf says it's not my problem". I would want the same coming to me. Maybe I'm unique in that I was a developer before getting into networking and that I understand both sides of the fence here.
Again, go have a look at Hanseng Bae's presentations, some of the packet traces, and what some of the resolutions were. It's hard enough to find the source of the these problems with the packet trace, and it would be a lot to expect of a developer to be able to solve it without the benefit of that.
I don't dispute that sometimes a code monkey doesn't need a good kick once in a while. I have had my share of "did something happen on the network last week?" tickets. But throwing tickets over a fence rarely gets problems solved.
February 28, 2011 at 5:57 p.m. UTC
I understand the developer side as well (remember, I built packetlife.net myself on top of Django). But let's consider the examples you mentioned, for instance: the reliance on obsolete protocols, poor ORM design, and database inefficiencies. None of these are network-related issues. While a networker with some programming or database background might be willing to help out, it's not his obligation. Likewise, I would not expect an application developer to help me troubleshoot BGP simply because his application relies on the network. In such a scenario, you cannot fault a networker for clearing the network as a cause and kicking back the ticket so that he can get on with the issues he is obligated pursue.
February 28, 2011 at 6:50 p.m. UTC
If a network engineer is supposed to debug software applications in search of non-network performance issues, why wouldn't the application developer be expected to perform throughput testing to rule out a problem with the network?
February 28, 2011 at 9:53 p.m. UTC
If you have the money....the best utility out there that serves this purpose are the FLUKE products. Optiview series...
It is unreal what these things can do.
http://www.flukenetworks.com/fnet/en-us/products/OptiView+Series+III+Integrated+Network+Analyzer/Overview
February 28, 2011 at 9:55 p.m. UTC
Cheers man, been playing around with it there.
There is a -r option which performs the test in the other direct, from server to client, but initiated from the client. Could we useful in identifying duplex mismatches.
I found the return throughput to be about 8% lower on average which is probably down to how the -r option operates...
February 28, 2011 at 10:34 p.m. UTC
Hi there,
Note that you can only test your 1-Gbps network with this iperf commands up to a certain latency. The default TCP window size being 85,3 kB (and even 20 kB on the client side that is sending the data), there is a side effect of TCP ruled by this formula :
TCP Bandwidth (bps) = TCP Window (B) * 8 / RTT (s)
Which gives you here a limit of the network round trip time (RTT) to be able to reach your 1000 Mbps of : 85,3 * 1024 * 8 / 1000000000 = 0,7 ms of RTT ! (0,2 ms with 20 kB TCP window)
As soon as you go out of your very local LAN, you cannot reach by default your 1 Gbps bandwidth with a single TCP connection !
Workaround : use iperf with the -w TCP window option and do your math to provide an apropriate greater value than the default ones, either on client and server sides since TCP should negotiate and use the lowest.
I once did such a test on a 1-Gig Metro Ethernet Network (500 km range) with 6 ms RTT and guess what... the throughput stuck at around 85 Mbps ! 85000 x 0.006 / 8 = 64 kB of Windows XP TCP stack default receive window. You can also tweak windows registry and other OSes TCP defaults to tune your TCP stack buffers.
Ignoring this could let you struggle for hours against the network supposed bottleneck.
As usual : "It's NOT the network !" here, it's TCP !
March 2, 2011 at 1:46 p.m. UTC
Has anyone used IP SLA to prove "it's not the network". I was thinking it could be useful for having historic data. For when "everyone knows it was the network this morning at 2am", could you run an IP SLA report to help disprove this type of thing?
March 2, 2011 at 7:03 p.m. UTC
With regards to throughput, OS tuning is essential. A useful link for info on tuning is this one:
In some cases, you can use NDT in place of iperf for your testing. The nice thing about NDT is that it doesn't require you to stand up a server - someone else has already done that for you:
http://www.internet2.edu/performance/ndt/
And since I'm tossing out URLs, folks may also find this one of some use:
March 4, 2011 at 11:05 a.m. UTC
But it must be the network! People need something to blame and something to belive in.
I once did some troubleshooting for a customer and heard that I was the third expert diagnosing their problem and also the third who told same that it was not the network.
I used to Tinkpads (with network chips from Intel), booted Linux and then used iperf to test network performance. Everything was fine. Then we tried one of their Desktop PCs (cheap network chip, Realtek IIRC) as host for iperf and performance was really bad (at least for UDP). I'll bet they hired some more consultants after me to proof that something was wrong with the cabling or the switch configuration.
BTW: Another nice testing tool is netcat or even ftp.
Customer: "When copy files between building A and B it's really slow when we copy files between Host inside one building everything is okay."
So I plugged my laptop into the customers network, wrote down the IP address, we walked over to the other building and and copy a large file
from the FTP-Sever on my Laptop. Performance was bad but about what
I would expect from a 10MBit link they used between the two buildings.
March 4, 2011 at 8:51 p.m. UTC
Does anyone know of a good way to test dynamic TCP windowing with iperf or something similar?
Here's the scenario: I recently ran into an issue with a Metro-E demarc device with throughput, and iperf tested perfect every time. Running 1G on the uplink port to the provider, and 100M on the client port running (client gear only had a 10/100 port, no 1G). In this state, client TCP throughput was down to around ~4-6Mbps when doing anything other than iperf (running to speedtest servers, downloading ISOs from web servers, etc). IPerf would run at about 94.9Mbps everytime, both directions, no issues.
Best I can figure is iperf uses a static TCP window size (says "TCP window size: when it starts), and cause it was static, the Ethernet demarc didn't have to deal with a dynamically changing window size, so it didn't stress the buffers on the box, and didn't reveal a problem. When we locked in both ports at either 1G (with different client hardware), or tuned down the uplink to 100M (so both sides matched), throughput problems went away. We've got the 1G<->100M scenario bypassed too by enabling flow control between the PE Metro-E switch and the Ethernet demarc.
Anywho, long story short - iperf tested perfect in this scenario, when there was a problem to be resolved. Only thing I can figure is the static TCP window size iperf uses, but if anyone has any other thoughts - I'd love to hear'em. If anyone has any idea how to test throughput with dynamic TCP windows, I'd love to hear that too.
Cheers.
March 13, 2011 at 8:42 a.m. UTC
Throughput and latency is only part of over all network performance. Most neworks these days have firewalls, load balacers or other equipment which is state aware. This leads to other bottle necks such as total amount of sessions and session setup/teardown pr second. Depending on the statefull implementations multiple sessions from a single host can be handled differently than multiple sessions from a single host.
In the lab we have heavy duty Ixia equipment to moddel such traffic, but I realy would like a tool which could be installed on a laptop for field usage. Open source/freeware cli is preffarable. Any suggestions?
April 19, 2011 at 5:15 p.m. UTC
do we have some document comparing iperf and ftp
July 11, 2011 at 9:22 p.m. UTC
In regards to historic performance data, look into OPnet's products. I count my lucky stars every day that the netadmin before me fought for deploying one in our enterprise. It saves having to have this network/server/storage/app argument every day.
November 8, 2011 at 4:19 p.m. UTC
Hi All,
Now I meet a question when I use Iperf to test packet loss. I use the "-o" option, but it couldn't creat the logfile in any where. My command are "iperf -c 192.168.1.100 -u -i 2 -o c:iperflog.txt" and "iperf -s -u -i 2 -o c:iperflog.txt". Could you help me or give me some advice?
Thaks a lot!
Luther
November 8, 2011 at 4:55 p.m. UTC
Hi Jeremy, When I use the command "iperf -c xxx -u -i 2 -o c:\iperflog.txt" , it couldn't creat the log flile. Could you help me or give me some advice? Thanks~
November 8, 2011 at 4:56 p.m. UTC
sorry, the command is"iperf -c xxx -u -i 2 -o c:\iperlog.txt"
February 1, 2012 at 7:12 a.m. UTC
Any iperf servers, so that I can use iperf clients on my PC or embedded devices to test the internet speed in simplest way.
ganapat
February 15, 2012 at 4:01 a.m. UTC
this tool really helps me prove to our customers that we are providing them their requested bandwidth and the issue is not on our side but already in their own network.
March 3, 2012 at 11:13 a.m. UTC
Hi,
Could you please help me to find out the reason for iperf not sending full data whatever is specified in the command line. for example i pumped 19Mbps but it send
only < 16 mbps.
C:\Users\ssrivastav\Desktop>iperf.exe -c 172.26.10.212 -B 172.26.10.235 -u -p 22
2 -b 19m -i 2 -t 1000
------------------------------------------------------------
Client connecting to 172.26.10.212, UDP port 222
Binding to local address 172.26.10.235
Sending 1470 byte datagrams
UDP buffer size: 63.0 KByte (default)
------------------------------------------------------------
[128] local 172.26.10.235 port 61562 connected with 172.26.10.212 port 222
[ ID] Interval       Transfer     Bandwidth
[128]  0.0- 2.0 sec  3.29 MBytes  13.8 Mbits/sec
[128]  2.0- 4.0 sec  2.88 MBytes  12.1 Mbits/sec
[128]  4.0- 6.0 sec  2.99 MBytes  12.5 Mbits/sec
[128]  6.0- 8.0 sec  3.20 MBytes  13.4 Mbits/sec
[128]  8.0-10.0 sec  3.11 MBytes  13.1 Mbits/sec
[128] 10.0-12.0 sec  3.01 MBytes  12.6 Mbits/sec
[128] 12.0-14.0 sec  2.80 MBytes  11.7 Mbits/sec
[128] 14.0-16.0 sec  2.98 MBytes  12.5 Mbits/sec
[128] 16.0-18.0 sec  3.05 MBytes  12.8 Mbits/sec
[128] 18.0-20.0 sec  3.26 MBytes  13.7 Mbits/sec
[128] 20.0-22.0 sec  2.92 MBytes  12.3 Mbits/sec
[128] 22.0-24.0 sec  3.15 MBytes  13.2 Mbits/sec
[128] 24.0-26.0 sec  2.85 MBytes  11.9 Mbits/sec
[128] 26.0-28.0 sec  2.99 MBytes  12.5 Mbits/sec
[128] 28.0-30.0 sec  3.20 MBytes  13.4 Mbits/sec
[128] 30.0-32.0 sec  2.62 MBytes  11.0 Mbits/sec
[128] 32.0-34.0 sec  3.18 MBytes  13.3 Mbits/sec
[128] 34.0-36.0 sec  2.89 MBytes  12.1 Mbits/sec
[128] 36.0-38.0 sec  3.14 MBytes  13.2 Mbits/sec
[128] 38.0-40.0 sec  2.98 MBytes  12.5 Mbits/sec
[ ID] Interval       Transfer     Bandwidth
[128] 40.0-42.0 sec  3.16 MBytes  13.3 Mbits/sec
[128] 42.0-44.0 sec  2.30 MBytes  9.64 Mbits/sec
[128] 44.0-46.0 sec  2.32 MBytes  9.74 Mbits/sec
[128] 46.0-48.0 sec  3.08 MBytes  12.9 Mbits/sec
[128] 48.0-50.0 sec  3.03 MBytes  12.7 Mbits/sec
[128] 50.0-52.0 sec  2.99 MBytes  12.6 Mbits/sec
regards,
sudhanshu
April 9, 2012 at 1:32 p.m. UTC
Hi...
I wanna know why i do test in a 10/100 Mbits switch and my results are like 69 or 70 Mbits????
I know that perhaps latency, but it's huge... i mean, 30 Mbits it's a lot...
Who can help???
May 28, 2012 at 10:11 a.m. UTC
Hi,
is it possible to get continuous tcp iperf results even if the link was disconnected and afterwards connected again?
June 18, 2012 at 5:07 a.m. UTC
Nice explanation and easy to experiment
September 2, 2012 at 4:38 a.m. UTC
Your blog was detailed & contained some excellent information. I am working as a QA for a network security firm and testing IP fragmentation. My testing involves checks for TCP, UDP & ICMP.
I used the native icmp command on linux with "-s" option to send fragmented icmp packets.
I ran iperf UDP packets with following command that helps the sender to send fragmented packets --> ./iperf -c 10.5.1.24 -p 5001 -b 7000000 -l 2000 -t 2
The packets are fragmented at 1472 + 528 bytes.
I am unable to send fragmentation for TCP though using similar command. The packets are being segmented by iperf which does not cause fragmentation.
Is there a way to achieve this?
Thanks
Mohan Iyer
April 22, 2013 at 4:32 p.m. UTC
Sometimes iperf is not enough. After a day spent troubleshooting poor server performances the only solution was to connect the customer PC directly to the server (without telling him). The server (physical FTP, just one NIC) was still slow, told him to try another patch cable and goodbye.
The ignorance about the basics of computing is the root of the problem, they blame the network because they don't know how their systems work.
I take it as a challenge and opportunity to increase my knowledge beyond the network boundaries, and if it's not a network problem my hours are billed ;-)
December 16, 2013 at 1:34 p.m. UTC
I noticed I'm not able to specify the local outgoing port.
even though I'm using -l 64000 -p 64000, it still uses port 49xx.
It does connect to the right ports, but when the outgoing local port is blocked, there's no way I can do these communication tests.