The premiere source of truth powering network automation. Open and extensible, trusted by thousands.
NetBox is now available as a managed cloud solution! Stop worrying about your tooling and get back to building networks.
Routing table profiling
By stretch | Monday, January 4, 2010 at 3:33 a.m. UTC
As of 12.0, Cisco IOS routers include a little-known feature to aid in tracking changes to the routing table: ip route profile. Here we examine how this feature offers an indicator of the network's stability.
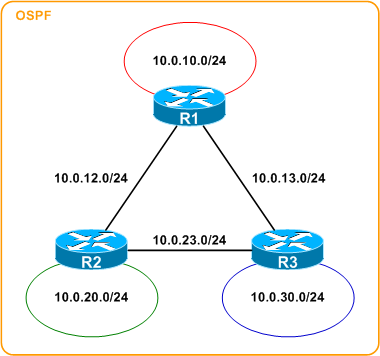
The routing table of any router in the above topology is predictable:
R1# show ip route
Codes: C - connected, S - static, R - RIP, M - mobile, B - BGP
       D - EIGRP, EX - EIGRP external, O - OSPF, IA - OSPF inter area
       N1 - OSPF NSSA external type 1, N2 - OSPF NSSA external type 2
       E1 - OSPF external type 1, E2 - OSPF external type 2
       i - IS-IS, su - IS-IS summary, L1 - IS-IS level-1, L2 - IS-IS level-2
       ia - IS-IS inter area, * - candidate default, U - per-user static route
       o - ODR, P - periodic downloaded static route

Gateway of last resort is not set

10.0.0.0/24 is subnetted, 6 subnets
C       10.0.10.0 is directly connected, Loopback0
C       10.0.12.0 is directly connected, FastEthernet0/0
C       10.0.13.0 is directly connected, FastEthernet0/1
O       10.0.30.0 [110/11] via 10.0.13.3, 00:00:03, FastEthernet0/1
O       10.0.23.0 [110/20] via 10.0.13.3, 00:00:03, FastEthernet0/1
                  [110/20] via 10.0.12.2, 00:00:03, FastEthernet0/0
O IA    10.0.20.0 [110/11] via 10.0.12.2, 00:00:03, FastEthernet0/0
First we need to enable route profiling:
R1# show ip route profile
IP routing profile not enabled
R1# conf t
Enter configuration commands, one per line.  End with CNTL/Z.
R1(config)# ip route profile
R1(config)# ^Z
R1# show ip route profile
IP routing table change statistics:
Frequency of changes in a 5 second sampling interval
-------------------------------------------------------------
Change/   Fwd-path  Prefix   Nexthop  Pathcount  Prefix
interval  change    add      change   change     refresh
-------------------------------------------------------------
0         0         0        0        0          0
1         0         0        0        0          0
2         0         0        0        0          0
3         0         0        0        0          0
4         0         0        0        0          0
5         0         0        0        0          0
10        0         0        0        0          0
15        0         0        0        0          0
20        0         0        0        0          0
25        0         0        0        0          0
30        0         0        0        0          0
55        0         0        0        0          0
80        0         0        0        0          0
105       0         0        0        0          0
130       0         0        0        0          0
155       0         0        0        0          0
280       0         0        0        0          0
405       0         0        0        0          0
530       0         0        0        0          0
655       0         0        0        0          0
780       0         0        0        0          0
1405      0         0        0        0          0
2030      0         0        0        0          0
2655      0         0        0        0          0
3280      0         0        0        0          0
3905      0         0        0        0          0
7030      0         0        0        0          0
10155     0         0        0        0          0
13280     0         0        0        0          0
Overflow  0         0        0        0          0
Route profiling works by inspecting the routing table every five seconds. Changes to routes between inspections are categorized into one or more of the five rightmost columns and their frequency is noted by row according to the leftmost column. For example, a value of 3 in the 2 row of the prefix refresh means that there were three five-second intervals during which two prefix refreshes occurred.
Yes, it's a bit confusing.
Before we dig any further, a description of each of the event columns (as described in the documentation) may be helpful:
- Forward-Path Change - This statistic is the number of changes in the forwarding path, which is the accumulation of prefix-add, next-hop change, and pathcount change statistics.
- Prefix-Add - A new prefix was added to the routing table.
- Next-Hop Change - A prefix is not added or removed, but the next hop changes. This statistic is only seen with recursive routes that are installed in the routing table.
- Pathcount Change - The number of paths in the routing table has changed. This statistic is the result of an increase in the number of paths for an Interior Gateway Protocol (IGP) prefix in the routing table.
- Prefix Refresh - Standard routing table maintenance; the forwarding behavior is not changed.
Of course, the table is empty immediately after enabling route profiling. After a few minutes, however, we begin to notice significant values:
R1# show ip route profile
IP routing table change statistics:
Frequency of changes in a 5 second sampling interval
-------------------------------------------------------------
Change/   Fwd-path  Prefix   Nexthop  Pathcount  Prefix
interval  change    add      change   change     refresh
-------------------------------------------------------------
0         96        96       96       96         96
1         0         0        0        0          0
2         0         0        0        0          0
3         0         0        0        0          0
4         0         0        0        0          0
5         0         0        0        0          0
10        0         0        0        0          0
15        0         0        0        0          0
20        0         0        0        0          0
25        0         0        0        0          0
30        0         0        0        0          0
55        0         0        0        0          0
80        0         0        0        0          0
105       0         0        0        0          0
130       0         0        0        0          0
155       0         0        0        0          0
280       0         0        0        0          0
405       0         0        0        0          0
530       0         0        0        0          0
655       0         0        0        0          0
780       0         0        0        0          0
1405      0         0        0        0          0
2030      0         0        0        0          0
2655      0         0        0        0          0
3280      0         0        0        0          0
3905      0         0        0        0          0
7030      0         0        0        0          0
10155     0         0        0        0          0
13280     0         0        0        0          0
Overflow  0         0        0        0          0
We can see that all five events have a value of 96 in the 0 row. This tells us two things: first, route profiling has been enabled for the last 8 minutes (96 * 5 seconds per interval = 480 seconds / 60 = 8 minutes). Second, since all columns only have an entry in the 0 row, this tells us that no changes have occurred; in other words, the routing table has remained stable.
But stability is boring, so let's force a change. Assume R2 loses its connection to the 10.0.23.0/30 network. This will be reflected as a change in the next update of the profile:
R1# show ip route profile
IP routing table change statistics:
Frequency of changes in a 5 second sampling interval
-------------------------------------------------------------
Change/   Fwd-path  Prefix   Nexthop  Pathcount  Prefix
interval  change    add      change   change     refresh
-------------------------------------------------------------
0         172       172      173      173        173
1         1         1        0        0          0
2         0         0        0        0          0
3         0         0        0        0          0
4         0         0        0        0          0
5         0         0        0        0          0
10        0         0        0        0          0
15        0         0        0        0          0
20        0         0        0        0          0
25        0         0        0        0          0
30        0         0        0        0          0
55        0         0        0        0          0
80        0         0        0        0          0
105       0         0        0        0          0
130       0         0        0        0          0
155       0         0        0        0          0
280       0         0        0        0          0
405       0         0        0        0          0
530       0         0        0        0          0
655       0         0        0        0          0
780       0         0        0        0          0
1405      0         0        0        0          0
2030      0         0        0        0          0
2655      0         0        0        0          0
3280      0         0        0        0          0
3905      0         0        0        0          0
7030      0         0        0        0          0
10155     0         0        0        0          0
13280     0         0        0        0          0
Overflow  0         0        0        0          0
At this point, there have been:
- 172 intervals where no forward-path changes have occurred,
- 1 interval where a single forward-path change has occurred,
- and 0 intervals where any other number of forward-path changes have occurred.
The same is true for prefix additions. The other three event categories remain unaffected (all 173 intervals detected 0 changes applicable to those categories).
If two such events were detected within the interval, 1 would appear in the 2 row of both columns instead. Likewise, if ten such events were detected within the interval, the 10 row would be incremented instead.
When R2's link is restored, we see the second event reflected in the profile:
R1# show ip route profile
IP routing table change statistics:
Frequency of changes in a 5 second sampling interval
-------------------------------------------------------------
Change/   Fwd-path  Prefix   Nexthop  Pathcount  Prefix
interval  change    add      change   change     refresh
-------------------------------------------------------------
0         238       239      240      239        239
1         2         1        0        1          1
2         0         0        0        0          0
3         0         0        0        0          0
4         0         0        0        0          0
5         0         0        0        0          0
10        0         0        0        0          0
15        0         0        0        0          0
20        0         0        0        0          0
25        0         0        0        0          0
30        0         0        0        0          0
55        0         0        0        0          0
80        0         0        0        0          0
105       0         0        0        0          0
130       0         0        0        0          0
155       0         0        0        0          0
280       0         0        0        0          0
405       0         0        0        0          0
530       0         0        0        0          0
655       0         0        0        0          0
780       0         0        0        0          0
1405      0         0        0        0          0
2030      0         0        0        0          0
2655      0         0        0        0          0
3280      0         0        0        0          0
3905      0         0        0        0          0
7030      0         0        0        0          0
10155     0         0        0        0          0
13280     0         0        0        0          0
Overflow  0         0        0        0          0
By now you've no doubt deduced that lower values (except the 0 row) indicate a more-stable routing table. This feature probably isn't ideal for enterprise-wide network management, but might come in handy when attempting to detect sporadic and/or short-lived fluctuations in the topology during troubleshooting.
Posted in Routing, Tips and Tricks
Comments
January 4, 2010 at 5:13 a.m. UTC
nice feature, I wonder if I'll see it anywhere in my CCNP studies...
Rofi Neron
January 4, 2010 at 1:28 p.m. UTC
That's cooool.
January 4, 2010 at 1:39 p.m. UTC
This is great, thanks for showing it. It's perfect for MPLS customers; you can see how much routing table churn is going on courtesy of your provider.
Sean
January 4, 2010 at 3:02 p.m. UTC
thanks for posting this.. it's a feature (one of many) that I had forgotten about but will certainly come in handy.
-ryan
January 4, 2010 at 7:59 p.m. UTC
Very nice feature, thanks for knowladge sharing.
Marek
January 4, 2010 at 10:56 p.m. UTC
nice, I wasn't aware of this, thanks.
January 5, 2010 at 12:24 a.m. UTC
Good stuff! Thanks for sharing.
January 5, 2010 at 3:51 p.m. UTC
Thanks for highlighting this feature and giving a succinct tutorial.. Is there a significant cost (CPU / memory) with enabling it? I added it to a few test routers and didn't notice much of a change.
BTW, the stats get interesting when Performance Routing is enabled.
Jeremy
May 16, 2011 at 7:00 a.m. UTC
@Rofi Neron: You'll see it in CCNP TSHOOT
/JZN
November 8, 2012 at 10:36 a.m. UTC
For MPLS VPNs - which routing table changes are reflected in the above command - global, VRFs or both ?
Thanks,
Khaled